Rate of Inventory Turnover: Formula & Industry Benchmarks
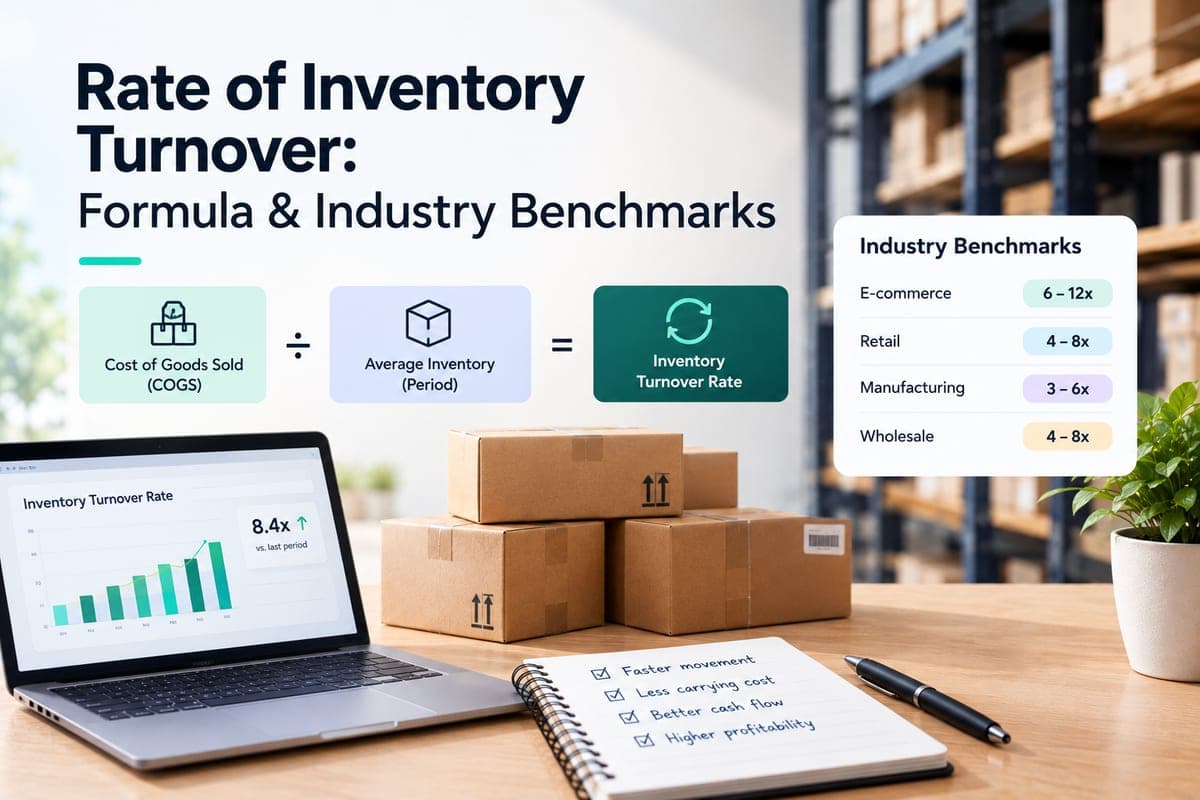
The rate of inventory turnover measures how many times a business sells and replaces its inventory over a given period — typically a year. It's calculated by dividing the cost of goods sold (COGS) by average inventory, and it's one of the clearest signals of how efficiently a company is converting stock into revenue.
Table of Contents
- What Is the Rate of Inventory Turnover?
- How to Calculate the Rate of Inventory Turnover
- Inventory Turnover in Days
- What Is a Good Inventory Turnover Ratio?
- High vs. Low Inventory Turnover: What Each One Means
- What Causes Low Inventory Turnover — and How to Fix It
- Limitations of the Inventory Turnover Ratio
- How Nventory Helps You Track and Improve Inventory Turnover
- Frequently Asked Questions
What Is the Rate of Inventory Turnover?
Inventory turnover tells you how quickly stock moves through your business. A higher number means inventory is selling and being replenished frequently; a lower number means goods are sitting on shelves longer before they sell.
Because unsold inventory ties up cash, storage space, and carrying costs, this ratio is one of the most widely used efficiency metrics in retail, ecommerce, and manufacturing finance. It appears in standard financial statement analysis alongside reference definitions such as Investopedia's entry on the inventory turnover ratio and the Wikipedia entry on inventory turnover.
How to Calculate the Rate of Inventory Turnover
The standard formula is:
Inventory Turnover Ratio = Cost of Goods Sold (COGS) ÷ Average Inventory

Average Inventory = (Beginning Inventory + Ending Inventory) ÷ 2
Some sources calculate turnover using sales instead of COGS, but this is less accurate. Sales figures include markup and margin, while COGS reflects your actual cost basis. For an apples-to-apples ratio, use COGS and average inventory valued at cost, not retail price.
Worked example:
- Cost of goods sold for the year: $2,400,000
- Beginning inventory: $180,000
- Ending inventory: $220,000
Average Inventory = ($180,000 + $220,000) ÷ 2 = $200,000
Inventory Turnover Ratio = $2,400,000 ÷ $200,000 = 12
This business turns over its entire inventory 12 times per year — roughly once a month.
Inventory Turnover in Days
Turnover is also commonly expressed as Days Inventory Outstanding (DIO) — how many days, on average, a unit of inventory sits before it sells:
Days Inventory Outstanding = 365 ÷ Inventory Turnover Ratio
Using the example above: 365 ÷ 12 ≈ 30.4 days. This business holds inventory for roughly a month before it sells, on average. DIO is often easier to communicate to non-finance stakeholders than a raw turnover ratio, since "your stock sits for 30 days" is more intuitive than "your turnover ratio is 12."
What Is a Good Inventory Turnover Ratio?
There's no single "good" number — it depends heavily on industry, product perishability, and margin structure. The ranges below are a reasonable synthesis of current industry data, but treat them as directional. Turnover figures vary meaningfully depending on whether they're calculated on a cost basis or a sales basis, and on whether the underlying dataset is public companies, SMBs, or a specific retail subsegment.
| Industry | Typical Annual Turnover | Why |
|---|---|---|
| Grocery / perishables | 10–20x | Perishable goods force fast cycling; some fresh categories run even higher |
| Ecommerce / subscription & consumables | 5–8x | Predictable reorder cycles support faster turns than general retail |
| General retail | 4–6x | Broad mix of fast- and slow-moving SKUs |
| Manufacturing | 4–8x | Varies by production cycle length and product complexity |
| Apparel & fashion | 4–6x | Seasonal cycles and markdown cadence slow this down versus consumables |
| Furniture & luxury goods | 2–4x | High margin, low velocity, longer consideration cycles |
The most useful benchmark isn't an industry table at all — it's your own historical trend. A ratio of 3 is a red flag for a grocery retailer and a perfectly normal number for a luxury furniture brand. Direction of change over time usually matters more than the absolute figure.
If you're specifically benchmarking an ecommerce operation, our companion guide to inventory turnover benchmarks for ecommerce goes deeper on vertical-level ranges, turnover by sales channel, and the tradeoff between turnover and service level.
High vs. Low Inventory Turnover: What Each One Means
A high turnover ratio generally signals strong sales and efficient inventory management. But an extremely high ratio can also mean you're running too lean — risking stockouts, lost sales, and missed volume-purchasing discounts because you're reordering too frequently in small batches.
A low turnover ratio usually means stock is sitting too long before it sells. That directly increases carrying costs — commonly cited at roughly 20 to 30% of inventory value per year across retail — raises obsolescence risk, and locks up cash that could be deployed elsewhere.
The goal isn't to maximise turnover. It's to match turnover to what your specific business and industry actually need.
What Causes Low Inventory Turnover — and How to Fix It
Low turnover usually traces back to one or more of these root causes:
- Overstocking from inaccurate demand forecasting. Ordering based on gut feel or outdated sales data leads to buying more than the market will absorb.
- Slow-moving SKUs that aren't being actively identified and liquidated. Dead stock quietly drags down your average without anyone noticing until a stock count.
- Inventory data that doesn't reflect reality. If your system shows stock that's already sold, damaged, or misallocated across channels, you're making purchasing decisions on bad information — which compounds the overstocking problem.
- Pricing or assortment that's out of step with the market, keeping products on shelves longer than they should be.
The fixes map directly to the causes: rationalise your SKU range regularly, act on slow-movers before they become dead stock, and make sure your inventory numbers are accurate and current across every channel and warehouse you sell from. That last point is where most turnover problems actually start — you can't make a good purchasing decision on stock data that's hours or days out of date. If your stock lives across several locations, our guides to warehouse management systems and cloud-based inventory operations cover the systems layer that keeps those counts honest.
Limitations of the Inventory Turnover Ratio
Worth knowing before you lean too hard on this single number: it's a lagging, aggregate metric. A healthy overall ratio can hide a handful of dead SKUs offset by a few fast-movers.
It's also sensitive to how you calculate it. COGS-based and sales-based versions of the ratio aren't directly comparable, and seasonal businesses can show misleading turnover if you're not averaging inventory over enough of the year. A business that measures average inventory from two January snapshots will report a very different number than one averaging twelve month-end positions.
Use it as a starting signal, not the whole picture. Pair it with SKU-level turnover and days-of-supply data before making purchasing or pricing decisions.
How Nventory Helps You Track and Improve Inventory Turnover
Most low-turnover problems trace back to the same root issue: purchasing decisions made on inventory data that's already stale by the time someone acts on it. Nventory addresses that directly:
- Real-time inventory sync in under 5 seconds across every connected channel, so stock levels reflect what's actually happened — not what happened a few hours ago.
- Unified visibility across your warehouses, so slow-moving stock in one location doesn't hide behind fast-moving stock in another when you're looking at your numbers.
- 99.9%+ inventory accuracy, which matters because a turnover ratio calculated from inaccurate inventory data is just a confident-looking wrong number.
- A free plan, so you can connect your own catalog and see your real-time inventory picture before paying anything.
To be straightforward about scope: Nventory doesn't calculate your turnover ratio for you today. It solves the upstream problem that makes the ratio worth trusting in the first place — accurate, current inventory data across every channel and location you sell from.
Closing
Inventory turnover is only as trustworthy as the inventory data behind it. If your stock counts are outdated the moment you calculate the ratio, you're optimising against a number that's already wrong. Keeping inventory accurate and synced in real time across every channel and warehouse is what makes the number worth acting on.
Frequently Asked Questions
It is a measure of how many times a business sells and replaces its inventory over a given period, calculated as cost of goods sold divided by average inventory. It is one of the standard efficiency metrics used in financial statement analysis, and it signals how quickly stock is converting into revenue.
Divide cost of goods sold by average inventory, where average inventory is beginning inventory plus ending inventory divided by two. A business with $2,400,000 in COGS and $200,000 in average inventory has a turnover ratio of 12, meaning it turns over its stock roughly 12 times a year.
It depends entirely on your industry. Grocery and perishables often run 10 to 20 times a year, general retail typically sits at 4 to 6, and furniture or luxury goods can be perfectly healthy at 2 to 4. Compare your ratio against your own historical trend and your specific industry rather than a single universal benchmark, since the direction of change usually matters more than the absolute number.
Not necessarily. High turnover usually signals efficient sales and inventory management, but an extremely high ratio can mean you are running too lean, risking stockouts, lost sales, and missed volume-purchasing discounts because you are reordering too frequently in small batches.
It typically means inventory is sitting too long before it sells, which increases carrying costs, raises the risk of obsolescence, and ties up cash that could be deployed elsewhere in the business. The usual root causes are overstocking from weak demand forecasting, slow-moving SKUs that are never actively liquidated, and inventory data that does not reflect reality.
Divide 365 by the inventory turnover ratio to get Days Inventory Outstanding, the average number of days a unit of stock sits before selling. A turnover ratio of 12 equals roughly 30 days of inventory on hand. Days are often easier to communicate to non-finance stakeholders than a raw ratio.
Use cost of goods sold and average inventory valued at cost. Sales-based calculations include markup and margin, which inflates the ratio and makes it incomparable with a cost-based figure. Keeping both sides of the formula on the same cost basis is what makes the number meaningful.
Improve demand forecasting to avoid overstocking, actively identify and liquidate slow-moving SKUs before they become dead stock, and make sure your inventory data is accurate and current across every channel and location. Purchasing decisions made on stale stock data are one of the most common root causes of low turnover.
Related Articles
View all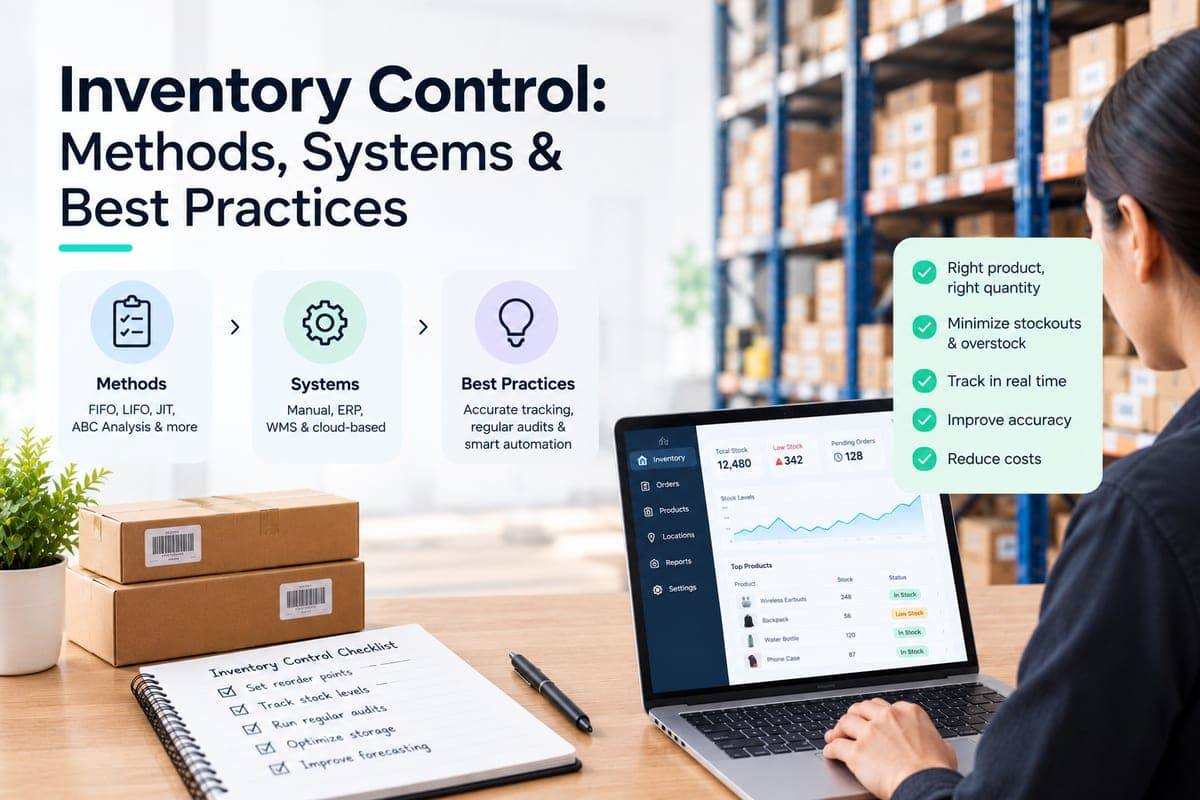
Inventory Control: Methods, Systems & Best Practices
What inventory control is, how it differs from inventory management, perpetual vs periodic systems, and the methods that keep stock counts accurate.
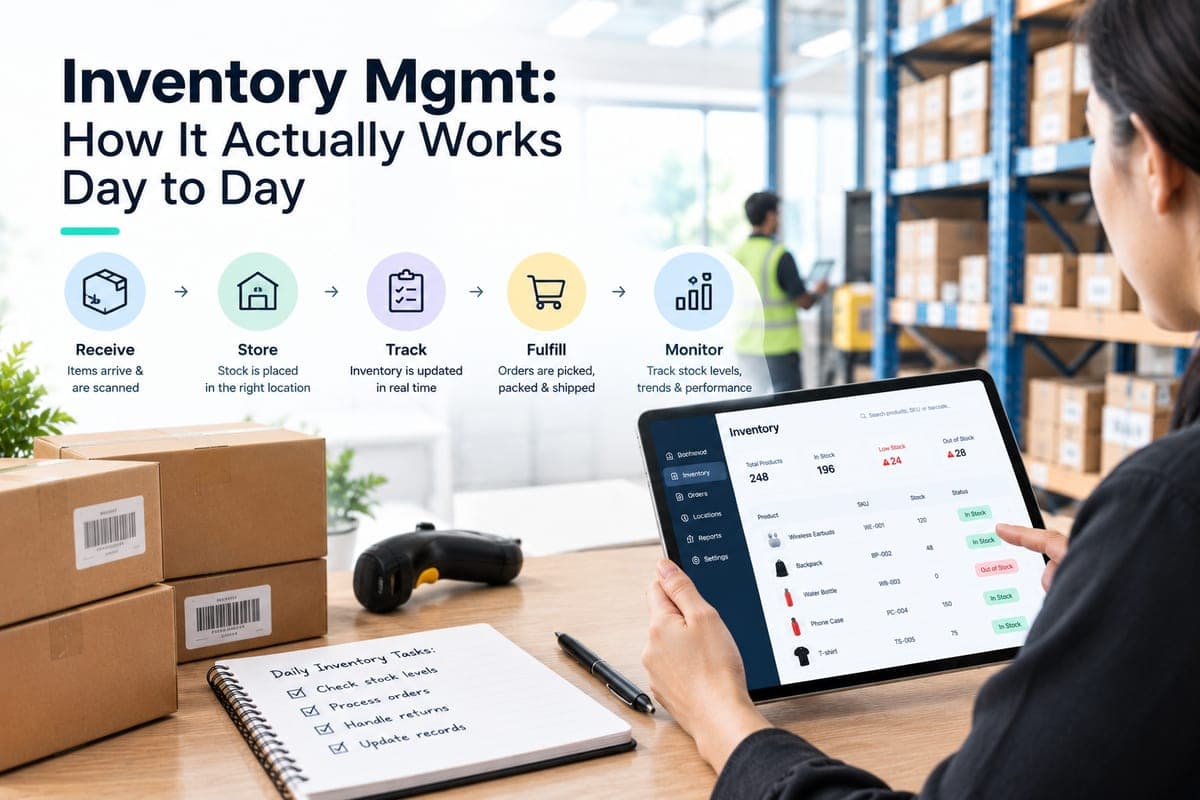
Inventory Mgmt: How It Actually Works Day to Day
The six-step inventory mgmt cycle, which role owns each part of it, the mistakes that quietly cost the most, and how to tell whether the process is working.